Impressive data, however, I'm a simple dude with simple questions:
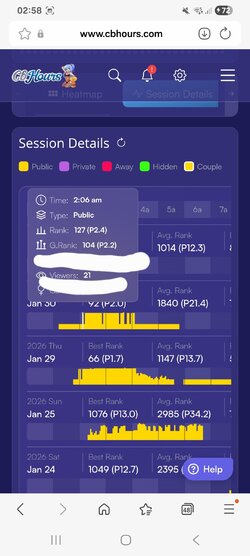
Does the ranking reflect how much is actually earned in a room?
You can have shitloads of traffic sources, native, affiliate, duplicate websites, pop unders, mailing reminders, shared memberships with vod sites (Streamate uses this a lot), to name but a few.
All of this name dropping fails to answer the following question:
Does the high position on the page tell us anything useful for the user acquisition funnel if there is any?
Freemium and premium cam sites don't share useful data insights,
they share jargon language instead.
How do I know it's jargon?
Because it's a language way more complicated than the idea it wishes to express or serve.
Rant over
")
This isn't anything new. The same group did this a year ago, but now it's growing to much larger proportions. Here's a more detailed analysis with more data and a comparison with 5 random models, and I think it's quite interesting.
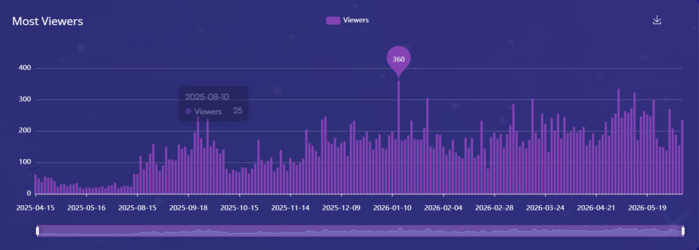
GROUP 1 — Newer accounts, manipulation visible from launch
BlairSanders, Chloedevinex, Hailey_madow, Hotbustybabex, Ravennadarcy, Siennaruh
These accounts all launched between April and November 2025, during or just before the main coordination period. Their entire observable history falls within the manipulated operation. None of them went through a natural poor-rank starting period. All received artificially elevated viewer counts either on launch day or within weeks of launching, while existing accounts in the group were simultaneously elevated.
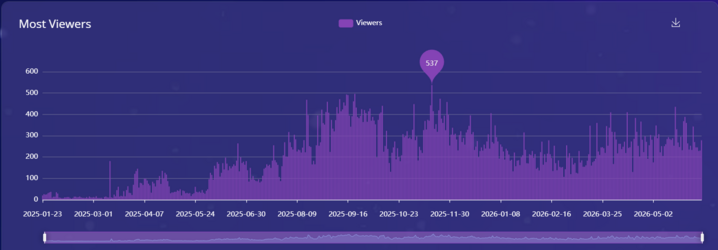
GROUP 2 — Older accounts, manipulation begins mid-2025
Ashleysinnx, Assmerising, Evasunderland, Evelyn_evyy, Juicy_jessye, Kiss_jess, Misskiarra
These accounts were active before the coordination scaled up. Their early history shows more independent activity with natural rank struggles visible in the data. The manipulation signatures appear clearly from mid-2025 onward, coinciding exactly with the launch of the Group 1 accounts. This timing suggests the operation expanded around mid-2025, bringing these established accounts into a coordinated rotation alongside the newly launched ones.
Not manipulating — 5 accounts (anonymous)
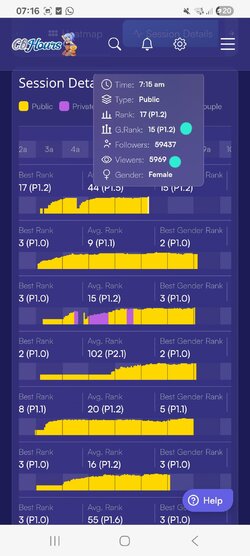
What all 13 manipulating accounts share:
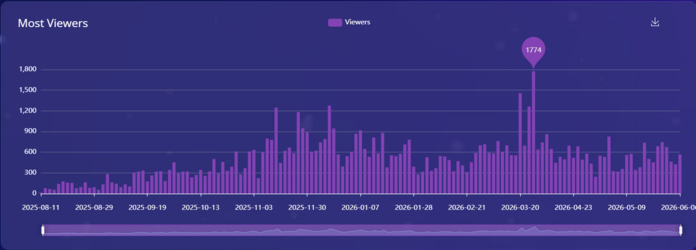
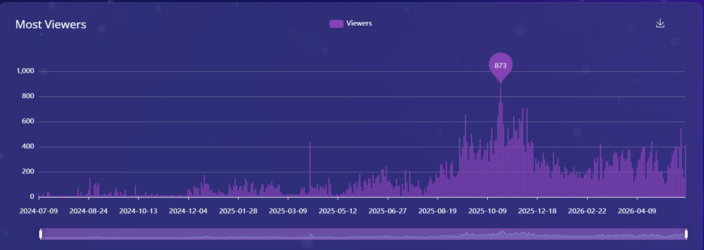
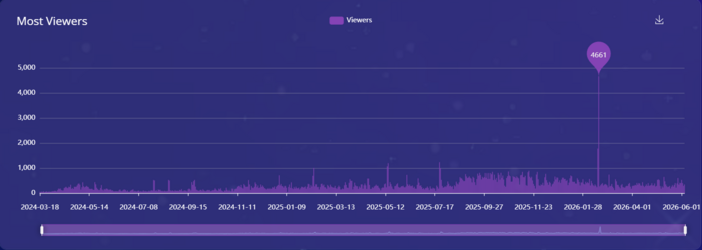
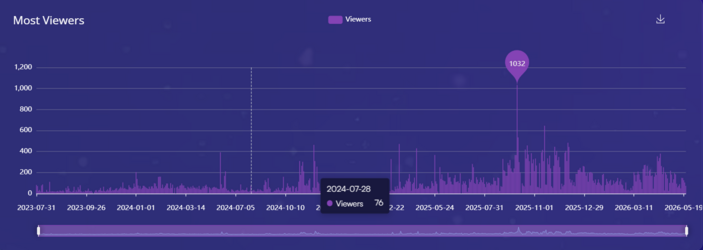
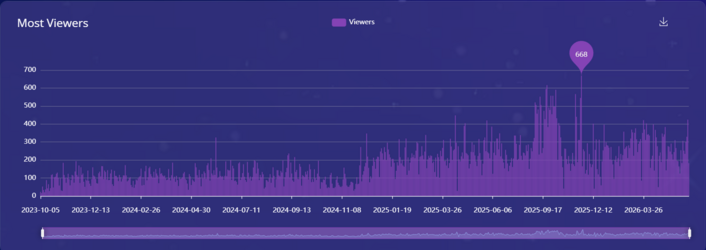
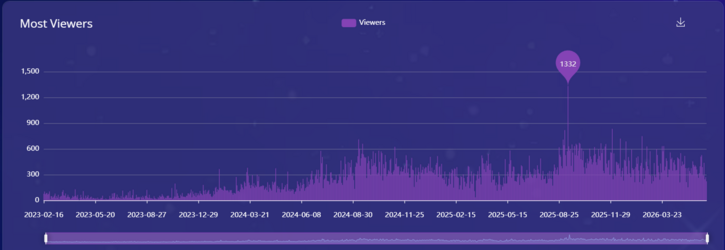
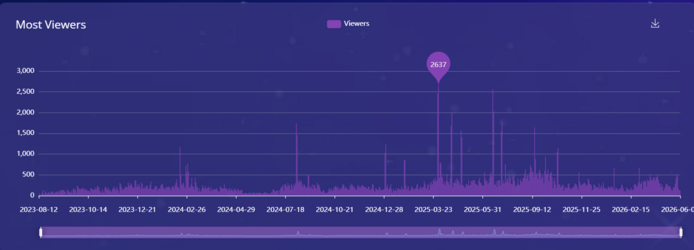
- Viewer spikes return to exactly the same baseline every single time — zero audience retention after any peak, across every account, every spike, over more than a year
- Rank position at some point exceeded what their organic viewer count could justify
- Coordinated rise and fall timing shared across multiple accounts in the same windows repeatedly throughout 2025 and into 2026
- Group 1 accounts skip the natural poor rank starting period entirely — Group 2 accounts show natural early struggles that stop once the coordination begins mid-2025
- Viewer pool rotates between accounts in a staggered sequence — rises happen together, falls happen one by one
- All 13 accounts maintain professional streaming hours consistently, which is consistent with a managed operation running coordinated shifts across all accounts simultaneously
- Rank jumps happen in concentrated windows — Sep–Oct 2025 and Mar–Apr 2026 — across multiple accounts simultaneously, not spread organically across the year
Shared coordinated windows across both groups:
Sep–Oct 2025: Group 1 accounts launching and being seeded simultaneously while Group 2 accounts are elevated. Multiple accounts from both groups active in the same window.
Nov–Dec 2025: Both groups active simultaneously with staggered falls across a 10-day window. Same accounts fall in the same sequence repeatedly.
Jan 2026: Tight 3-day window where multiple accounts across both groups rise simultaneously and fall within the same week.
Mar–Apr 2026: Largest observed window. Up to 7 accounts across both groups elevated simultaneously — the peak of the coordinated operation.
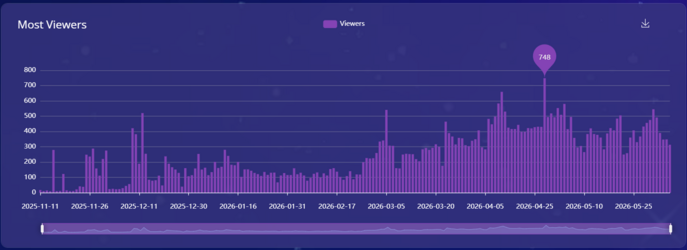
Apr–May 2026: Staggered falls across both groups over approximately 3 weeks. One account rises as others begin falling — baton pass clearly visible.
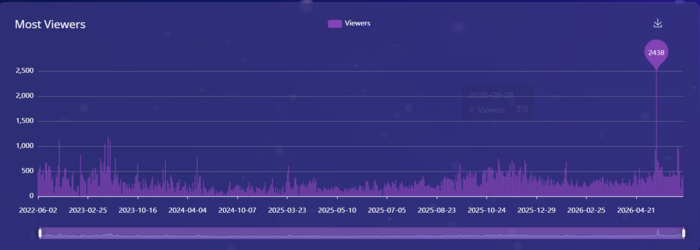
How the operation continued and escalated into 2026:
Rather than slowing down after the initial 2025 coordination period, the operation intensified significantly into 2026. The coordination windows became larger, involved more accounts simultaneously, sustained elevated viewer counts for longer periods, and achieved higher peak viewer numbers than any window observed in 2025.
January 2026 marks the first moment where both groups operate in full parallel simultaneously rather than in sequence. February 2026 shows a brief consolidation period consistent with the operation pausing between cycles. March 2026 escalates with 6 or more accounts elevated at the same time — the largest sustained window observed up to that point. April 2026 is the single most coordinated month in the entire observation period — up to 7 or 8 accounts across both groups elevated simultaneously, representing the full operational capacity of the scheme at maximum scale. May 2026 follows the characteristic staggered fall pattern with the final visible baton pass in the dataset, all accounts returning to their pre-elevation baselines with zero audience retention as observed after every previous cycle. June 2026 shows the operation in a consolidation phase between cycles with viewer counts returned to organic baseline levels.
The same staggered fall pattern, the same zero audience retention, and the same coordinated timing windows repeat without exception from mid-2025 through June 2026. The operation did not slow down or stop — it grew.
What the 5 anonymous legitimate accounts have that the 13 do not:
How they grew:
- All started with poor rank and low viewers and never skipped the difficult early period that every new account goes through
- All streamed consistently for months or years before anything meaningful happened with their rank — that struggle period is clearly visible in the data
- Growth was slow, irregular and unpredictable the way real individual audience building looks — no shortcuts, no sudden jumps without explanation
- Over time consistent work built genuinely large audiences through compounding — each spike added a small permanent layer to their floor and over time those layers accumulated into a significantly higher baseline
What makes them different at every stage:
- Hours and rank move together at every point in their history — when they streamed more their rank improved, when they took days off their rank dropped, the relationship between effort and result is visible and logical throughout
- Every major viewer spike left a permanently raised baseline afterward — the audience that came in partially stayed and never fully left, which is what real audience retention looks like
- Rank reflects real viewers at every point — there is never a moment where their rank is higher than their viewer count justifies
- The three metrics — online hours, rank and viewers — all move together and make sense as a connected system at every stage of their history
- When rank drops it matches exactly the days with low or zero streaming hours — everything is connected and explainable
- Rank charts show natural daily volatility — moving up and down every single session in response to real competition — unlike the manipulating accounts where rank sits artificially stable between boost windows
- The largest viewer spikes produce permanently elevated baselines that never return to previous levels — each peak compounds into a higher permanent floor, which is the definitive signature of a real audience growing over time
The single defining difference in one sentence:The 5 anonymous legitimate accounts have an audience that stays and a rank they earned through real work over time. The 13 manipulating accounts have viewers that disappear completely every single time and a rank that was given to them artificially, because the viewers were never real.
Why the coordinated windows cannot be explained by platform seasonality:
A natural alternative explanation for the shared elevation windows across the 13 accounts would be platform-wide seasonal trends — the argument that everyone gets more viewers at the same time of year simply because the platform is busier during those periods.
This explanation is ruled out by the behavior of the 5 anonymous legitimate accounts. Their peaks and growth periods are completely independent of each other and completely independent of the windows where the 13 accounts coordinate. There is no observable moment where two or more legitimate accounts spike simultaneously in a way that mirrors the 13 account windows. Their timelines are on entirely different trajectories, all peaking and falling at completely different times driven by their own individual circumstances.
If the coordinated windows in the 13 accounts were caused by platform seasonality or any external factor affecting all accounts equally, the legitimate accounts would show similar shared elevation patterns at the same times. They do not. This means the coordination visible across the 13 accounts is internal to that group and not explainable by any external platform-wide factor. It is caused by something specific to those 13 accounts and those 13 accounts only.
This finding eliminates the most plausible innocent explanation for the pattern and significantly strengthens the conclusion that the coordination is deliberate.